One guided lesson · 60 minutes

Exponents → SAT Models

Every SAT problem appears before its helper questions. Read the original, solve the steps, then submit the final answer.

0 / 18
Questions correct
0% complete
01

15 minutes

Exponent Foundations

Goal: understand what the exponent controls, including zero and negative exponents.

1Complete one table

Fill in both rows. Use fractions or decimals.

x-2-1012
2x
(½)x
2Multiple choice

Why is 2−3 equal to 1/8 rather than −8?

3Short answer

Complete the identity: (½)x = 2_____

4Four quick calculations

Evaluate without a calculator.

02

10 minutes

Desmos Graph Lab

Your task

Graph three functions and compare them.

  1. Open Desmos.
  2. Enter y=2^x, y=(1/2)^x, and y=2^(-x).
  3. Click each graph at x = −2, −1, 0, 1, and 2.
  4. Use what you see to answer question 5.
Open Desmos ↗
5Multiple choice

Which two graphs overlap exactly?

03

30 minutes

Guided SAT Problems

Each block is one problem. The original SAT prompt comes first; the smaller questions underneath are steps toward its final answer.

Main SAT problem · the problem from the previous lesson
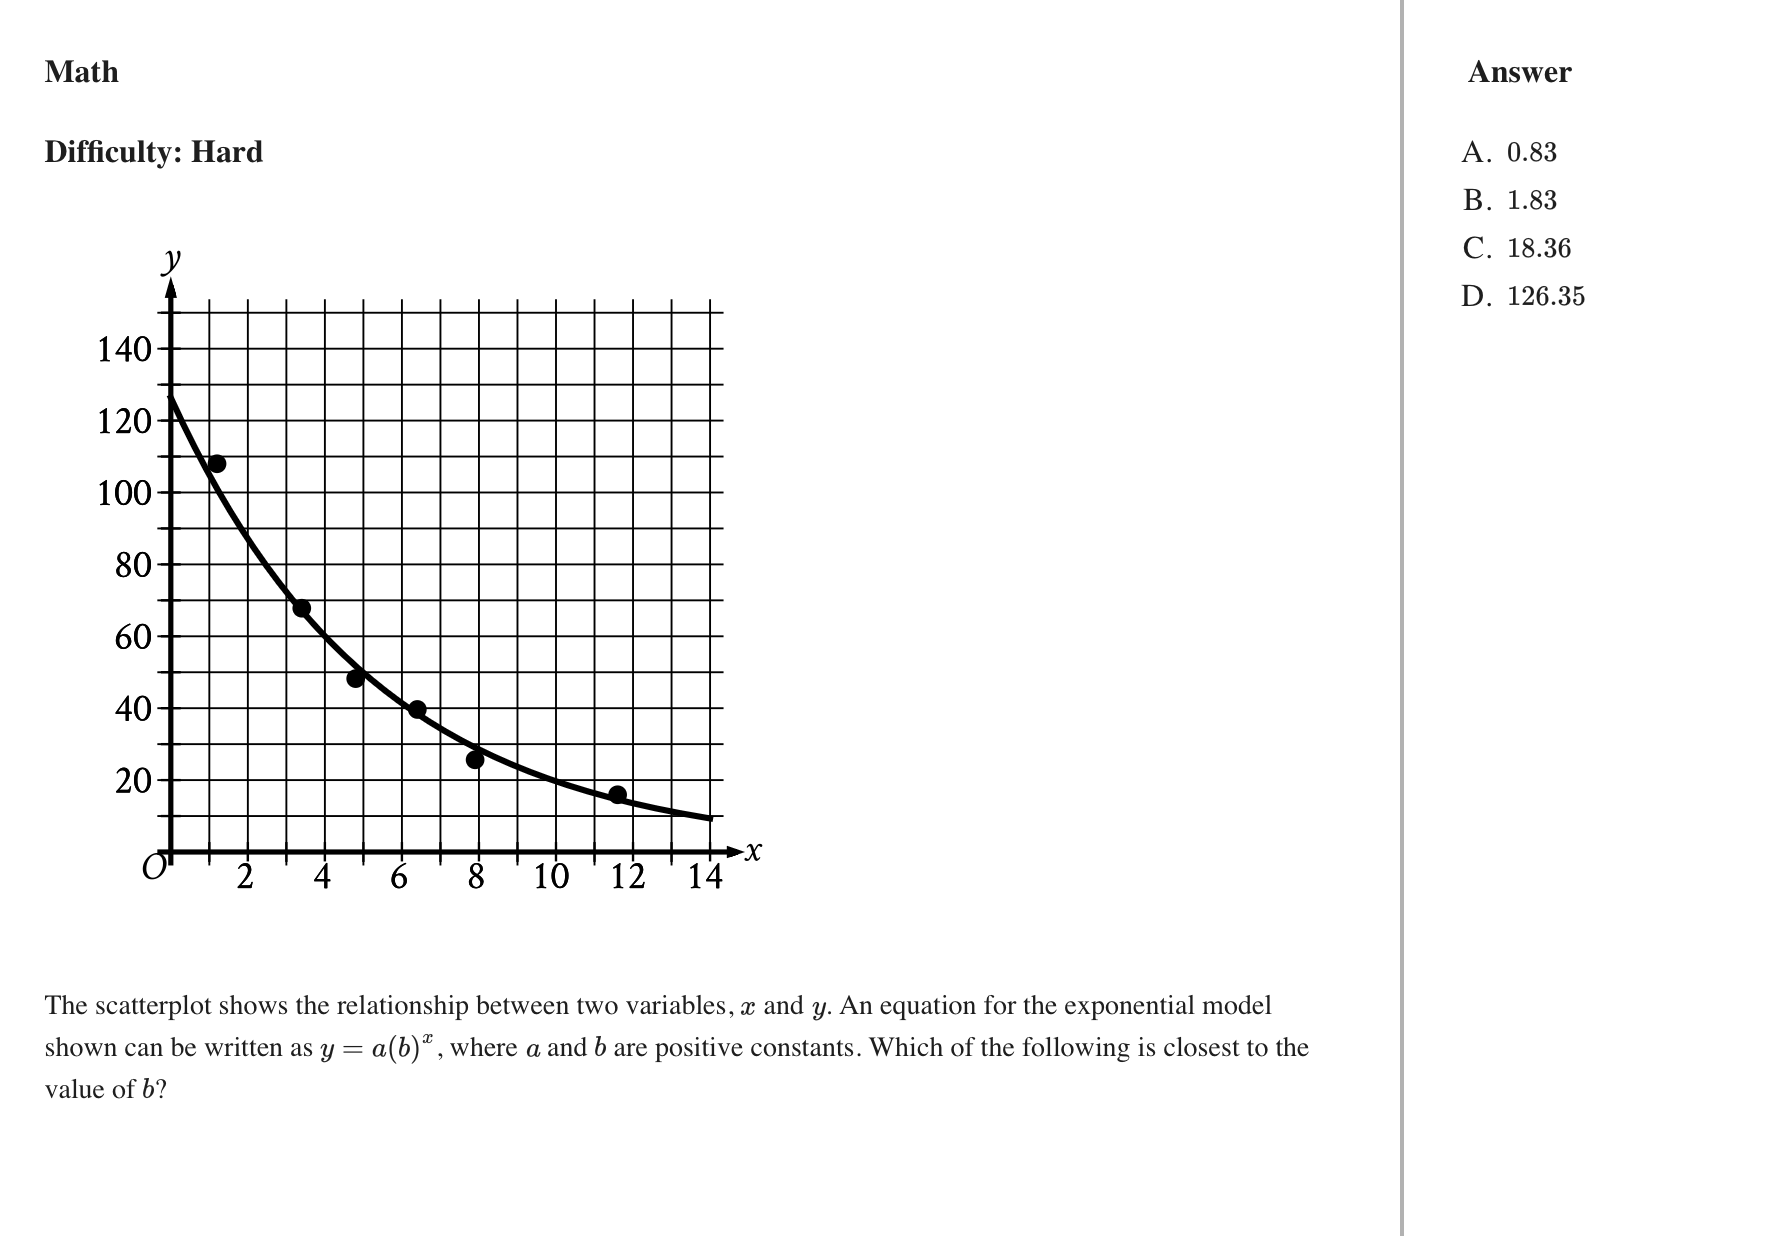
Problem A — Exponential decay

Read this first
Original SAT exponential model problem with a decreasing scatterplot
Then solve it in steps

The questions below unpack the same problem. They are not separate exercises.

6Step 1 of 3

Estimate the y-intercept. In y = a(b)x, approximately what is a?

7Step 2 of 3

The curve decreases as x increases. What must be true about b?

8Final SAT answer

Which answer choice is closest to the value of b?

Main SAT problem · Question ID d6af3572
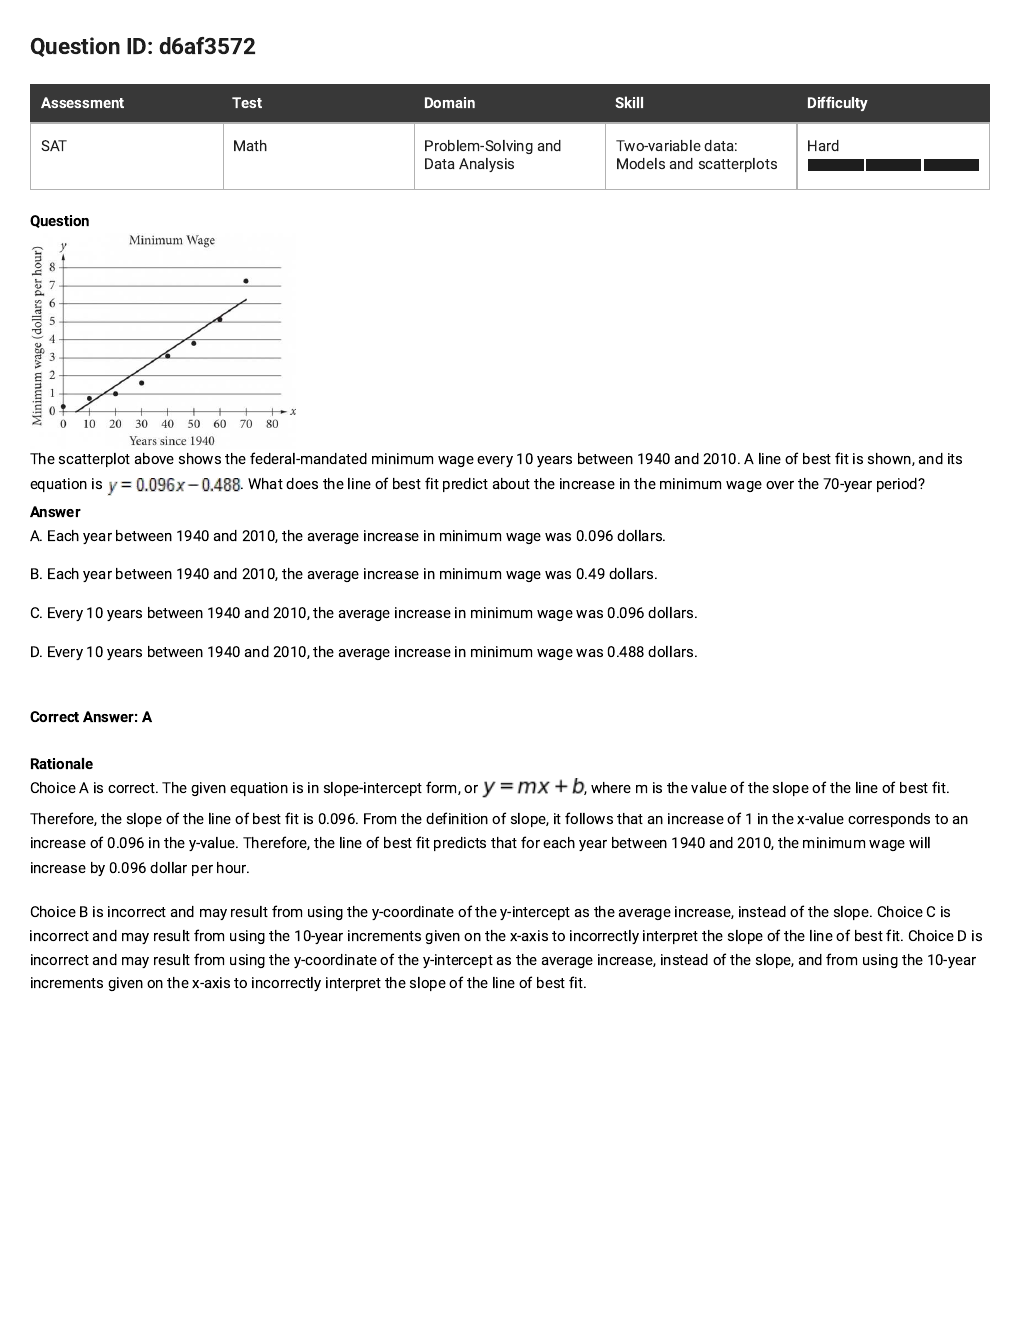
Problem B — Interpreting slope in context

Read this first
Original SAT minimum wage line-of-best-fit problem
Then solve it in steps

The questions below unpack the same problem. They are not separate exercises.

What the variables meanx = years since 1940y = minimum wage in dollars per hourModel: y = 0.096x − 0.488
9Step 1 of 3

What does an increase of 1 in x represent?

10Step 2 of 3

What is the slope of the model?

11Final SAT answer

What does the line of best fit predict?

Main SAT problem · Question ID 2e8027b0
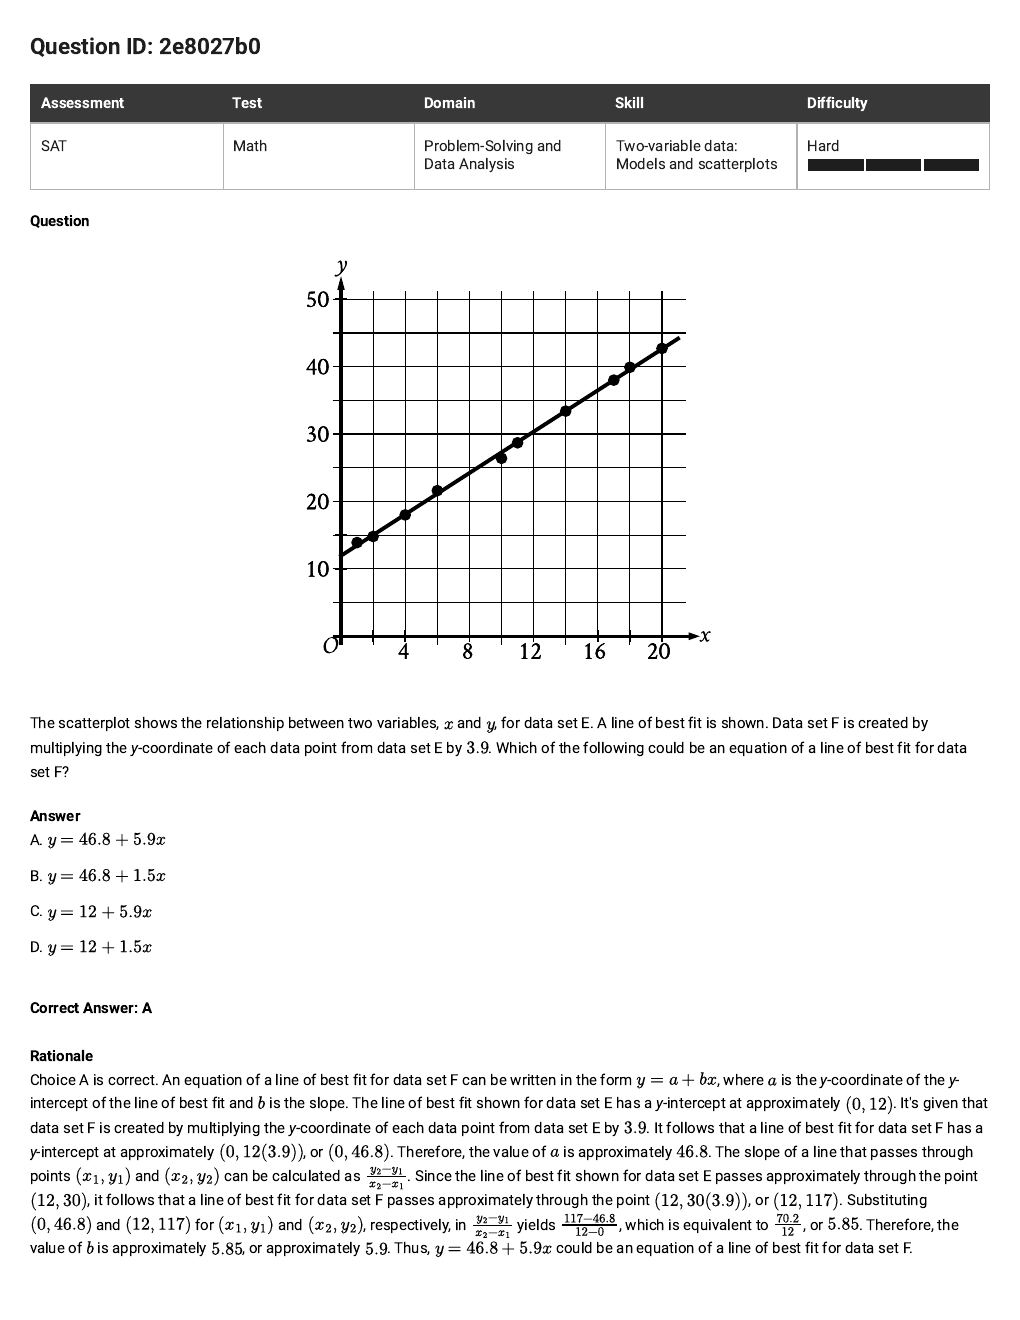
Problem C — Transforming a data set

Read this first
Original SAT data transformation problem
Then solve it in steps

The questions below unpack the same problem. They are not separate exercises.

What changes?Every y-coordinate is multiplied by 3.9.Therefore both the y-intercept and the slope are multiplied by 3.9.
12Step 1 of 3

The original y-intercept is about 12. What is the new y-intercept?

13Step 2 of 3

The original slope is about 1.5. What is the new slope?

14Final SAT answer

Which equation could be a line of best fit for data set F?

Main SAT problem · Question ID 1e1027a7
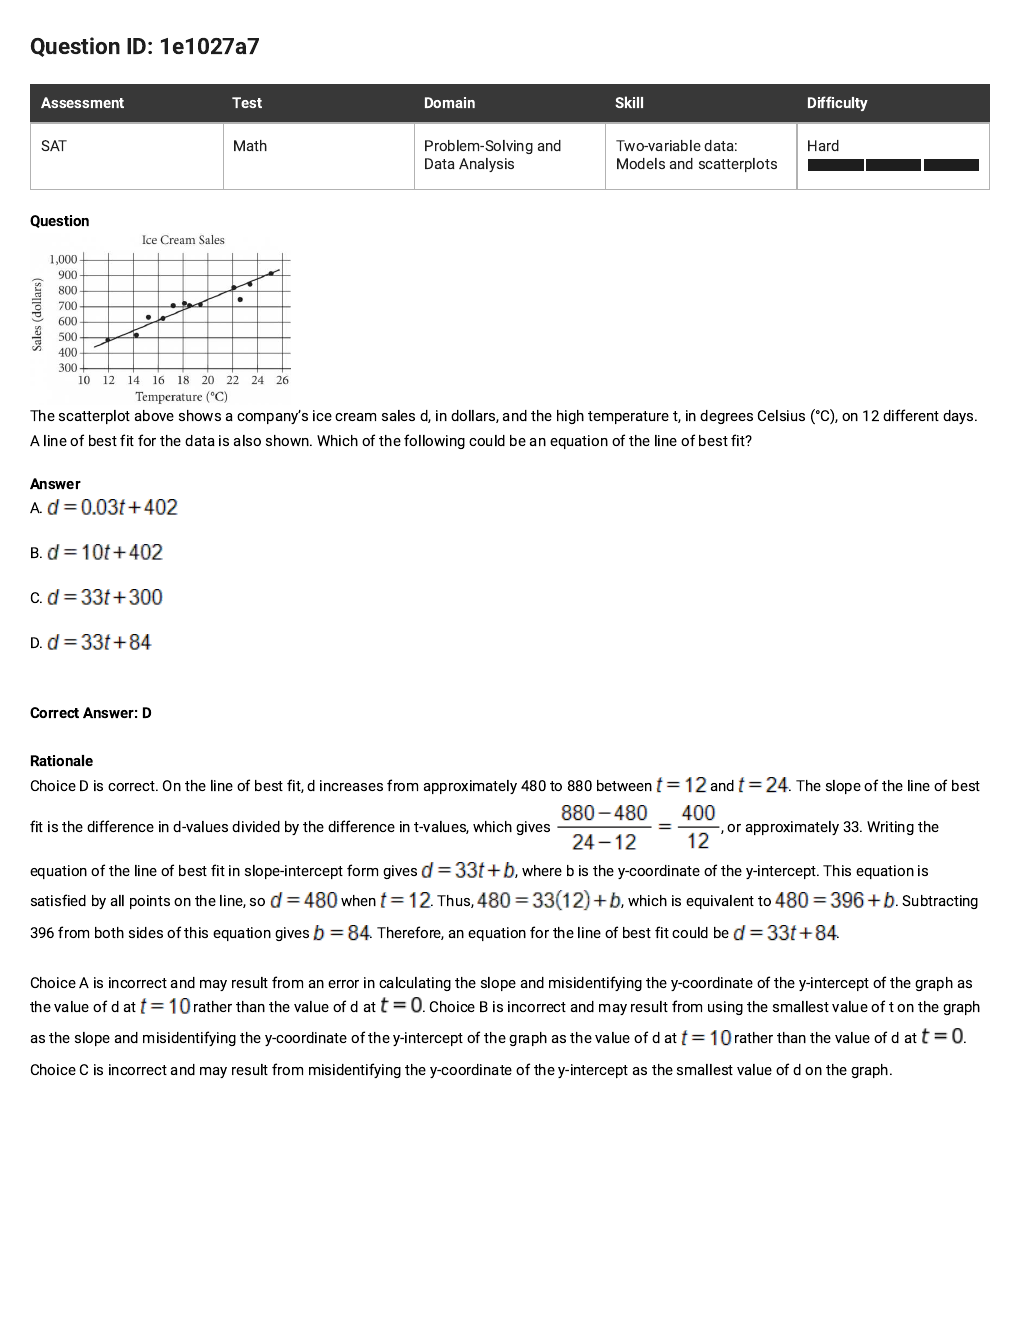
Problem D — Building a line of best fit

Read this first
Original SAT ice cream sales line-of-best-fit problem
Then solve it in steps

The questions below unpack the same problem. They are not separate exercises.

What the variables meant = high temperature in °Cd = ice cream sales in dollarsUse two points on the drawn line, not two scatterplot dots.
15Step 1 of 3

Using about (12, 480) and (24, 880), estimate the slope.

16Step 2 of 3

Use d = 33t + b and the point (12, 480). Find b.

17Final SAT answer

Which equation could represent the line of best fit?

04

5 minutes

Exit Ticket

18Multiple choice

Which statement correctly distinguishes linear and exponential models?