Homework · Medium + Hard · Two-variable data
Models and Scatterplots
Eight original SAT and PSAT problems, grouped by model type. Start with nonlinear models, then practice lines of best fit and prediction error.
0 / 20steps correct
0% complete 02 · New practice
Linear Models
Move from reading a rate to building and evaluating a model, then finish with a short review.Linear modelC. Slope from a line of best fit
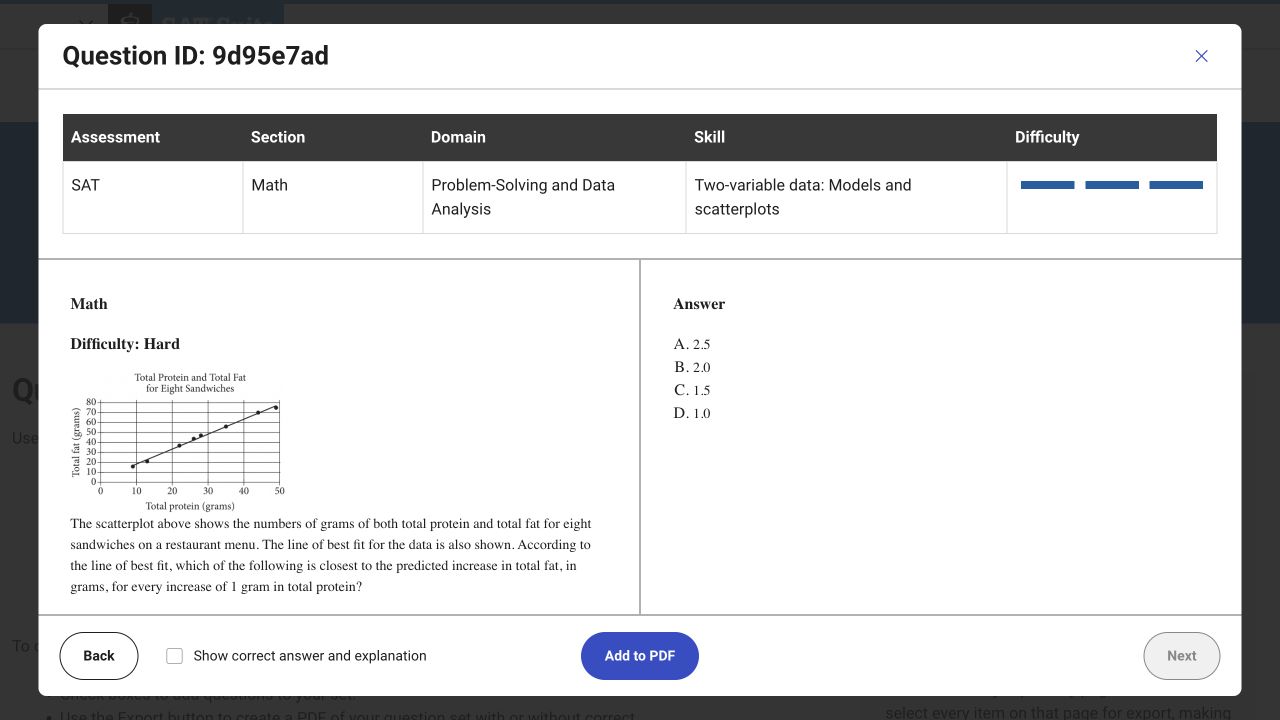
Original SAT Question Bank problem · 9d95e7ad · new
HardWork from the same problem below.Use the guiding questions first, then submit the final SAT answer.
9Guiding step
Using approximately (20, 33) and (40, 63), calculate the slope.
10Final SAT answer
What is the predicted increase in total fat for every 1-gram increase in total protein?
Linear modelD. Average rate of change from two data points
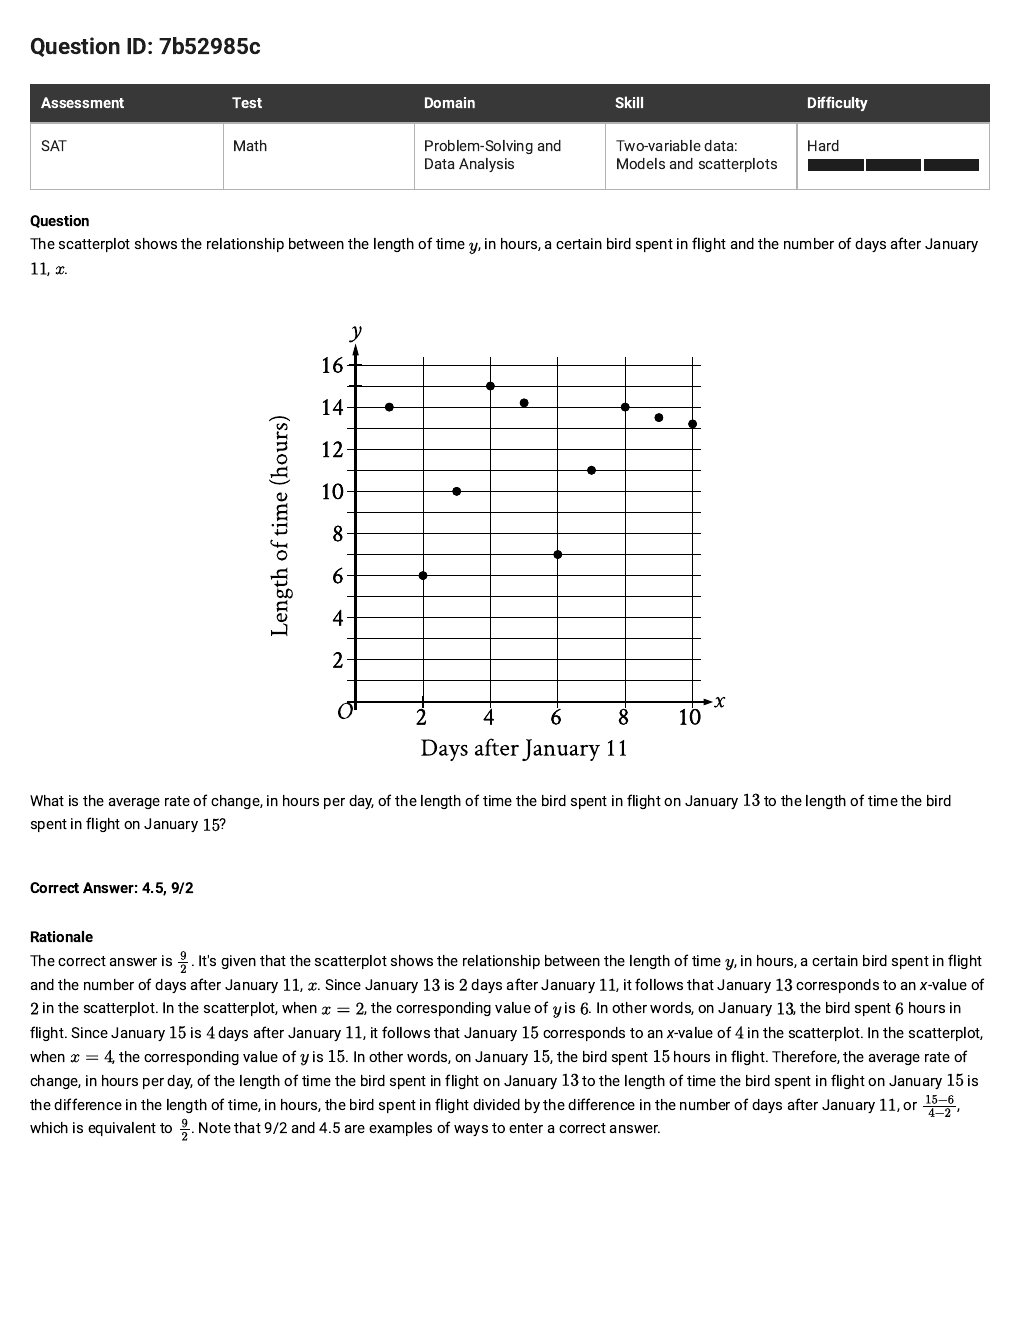
Original SAT Question Bank problem · 7b52985c
HardWork from the same problem below.Use the guiding questions first, then submit the final SAT answer.
11Guiding step
Which two ordered pairs represent January 13 and January 15?
12Final SAT answer
Find the average rate of change in hours per day.
Linear modelE. Choosing an equation from a line of best fit
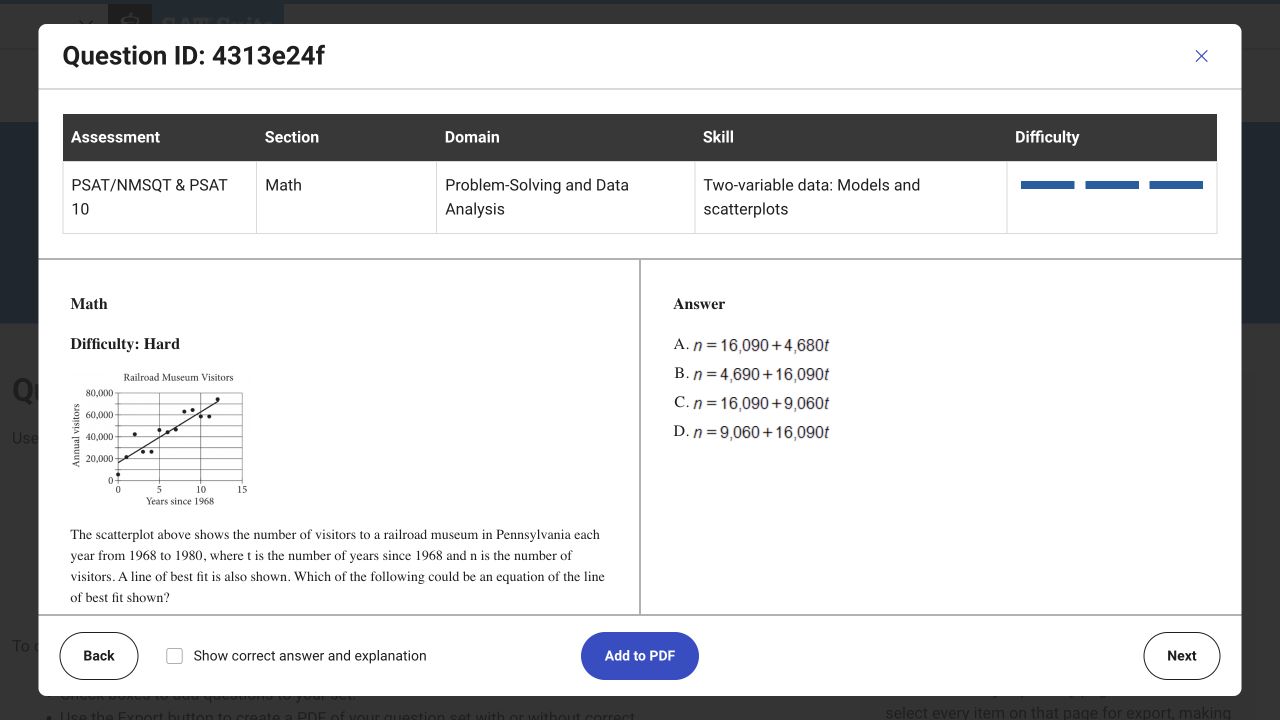
Original PSAT/NMSQT & PSAT 10 Question Bank problem · 4313e24f · new
HardWork from the same problem below.Use the guiding questions first, then submit the final SAT answer.
13Guiding step
Estimate the y-intercept of the line of best fit.
14Final PSAT answer
Which equation could represent the line of best fit?
Linear modelF. Medium checkpoint: measuring prediction error
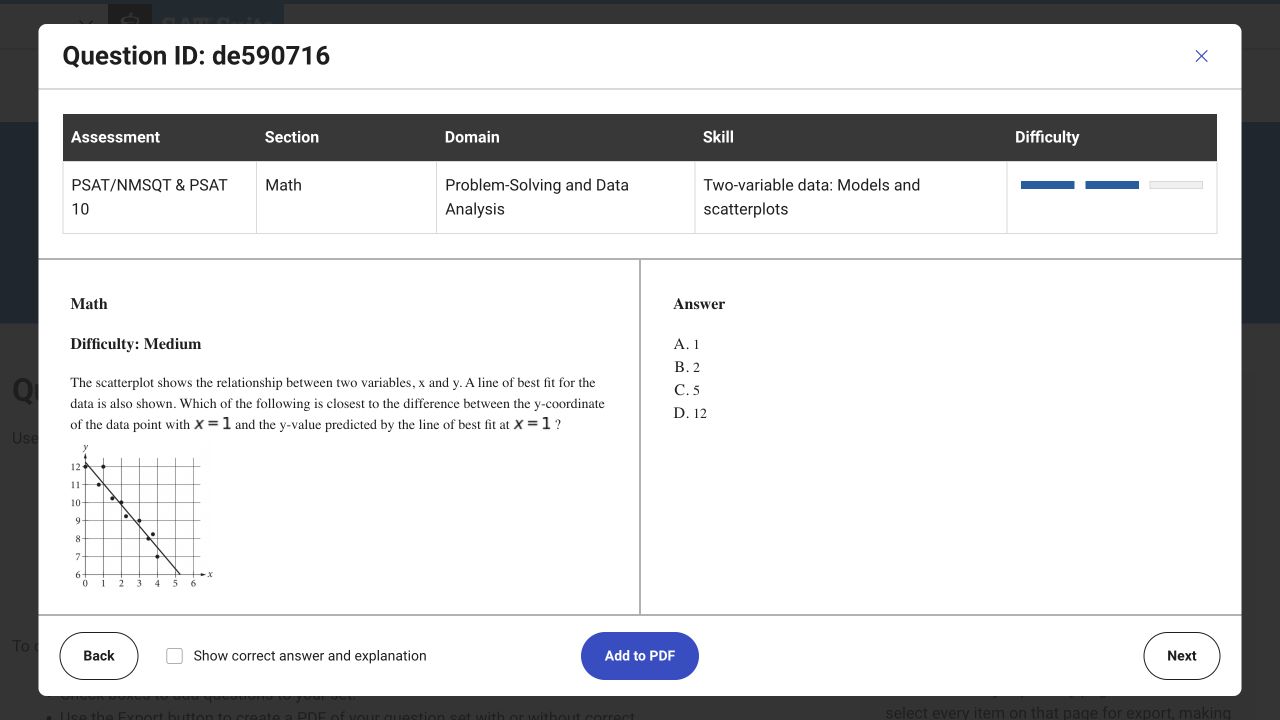
Original PSAT/NMSQT & PSAT 10 Question Bank problem · de590716 · new
MediumWork from the same problem below.Use the guiding questions first, then submit the final SAT answer.
15Guiding step
At x = 1, what y-value does the line of best fit predict?
16Final PSAT answer
The actual point has y = 12. What is the difference between the actual and predicted values?
Linear modelG. Estimating a line from a cluster of points
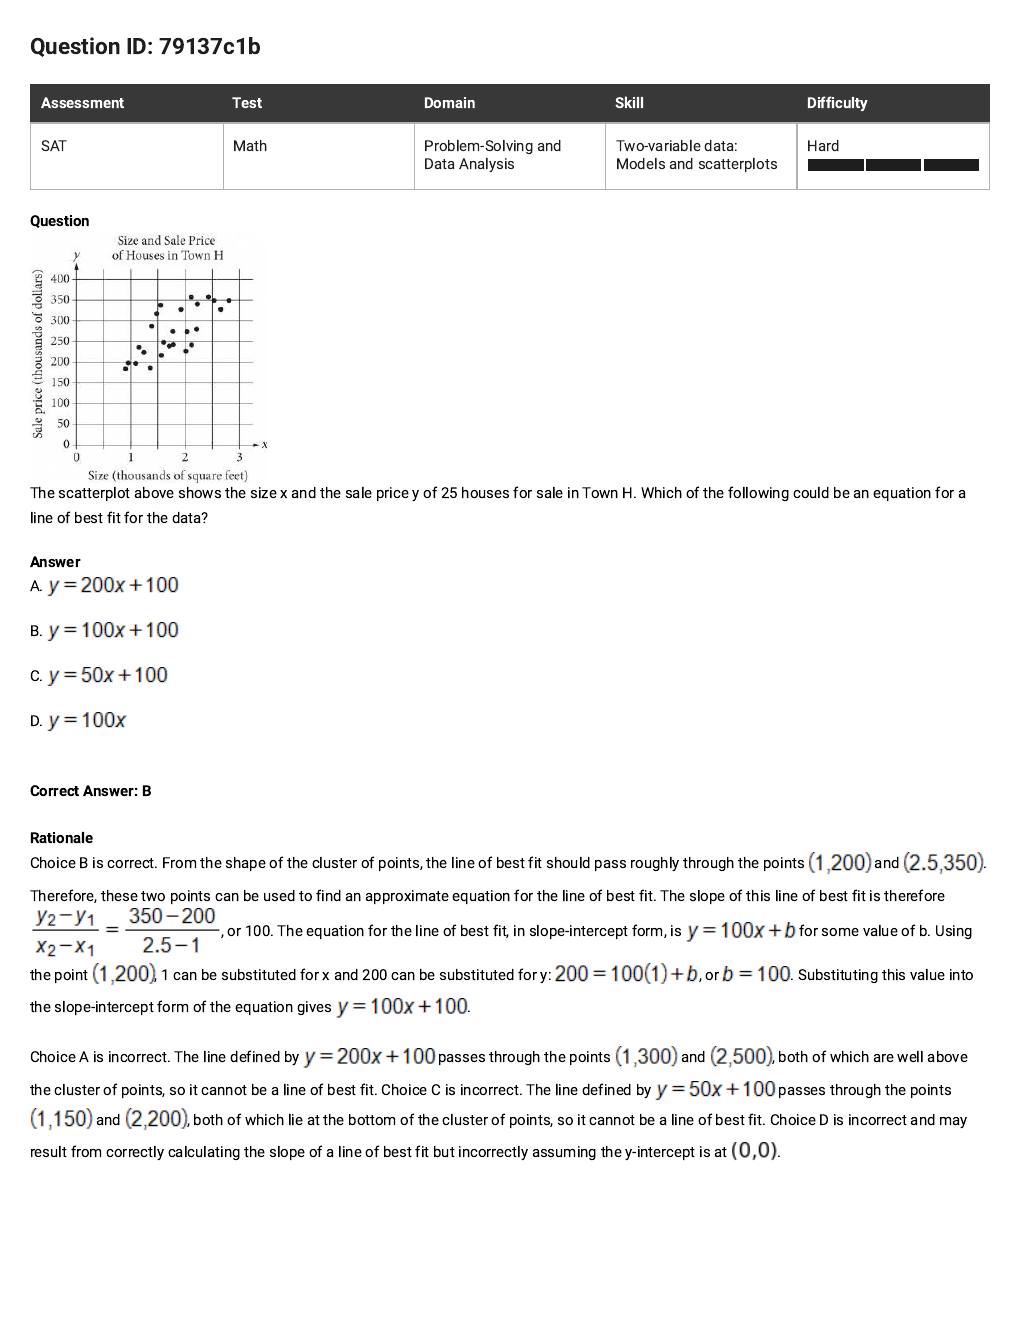
Original SAT Question Bank problem · 79137c1b · new
HardWork from the same problem below.Use the guiding questions first, then submit the final SAT answer.
17Guiding step
Using about (1, 200) and (2.5, 350), estimate the slope.
18Final SAT answer
Which equation could be a line of best fit for the data?
Linear modelH. Final review: scaling a slope
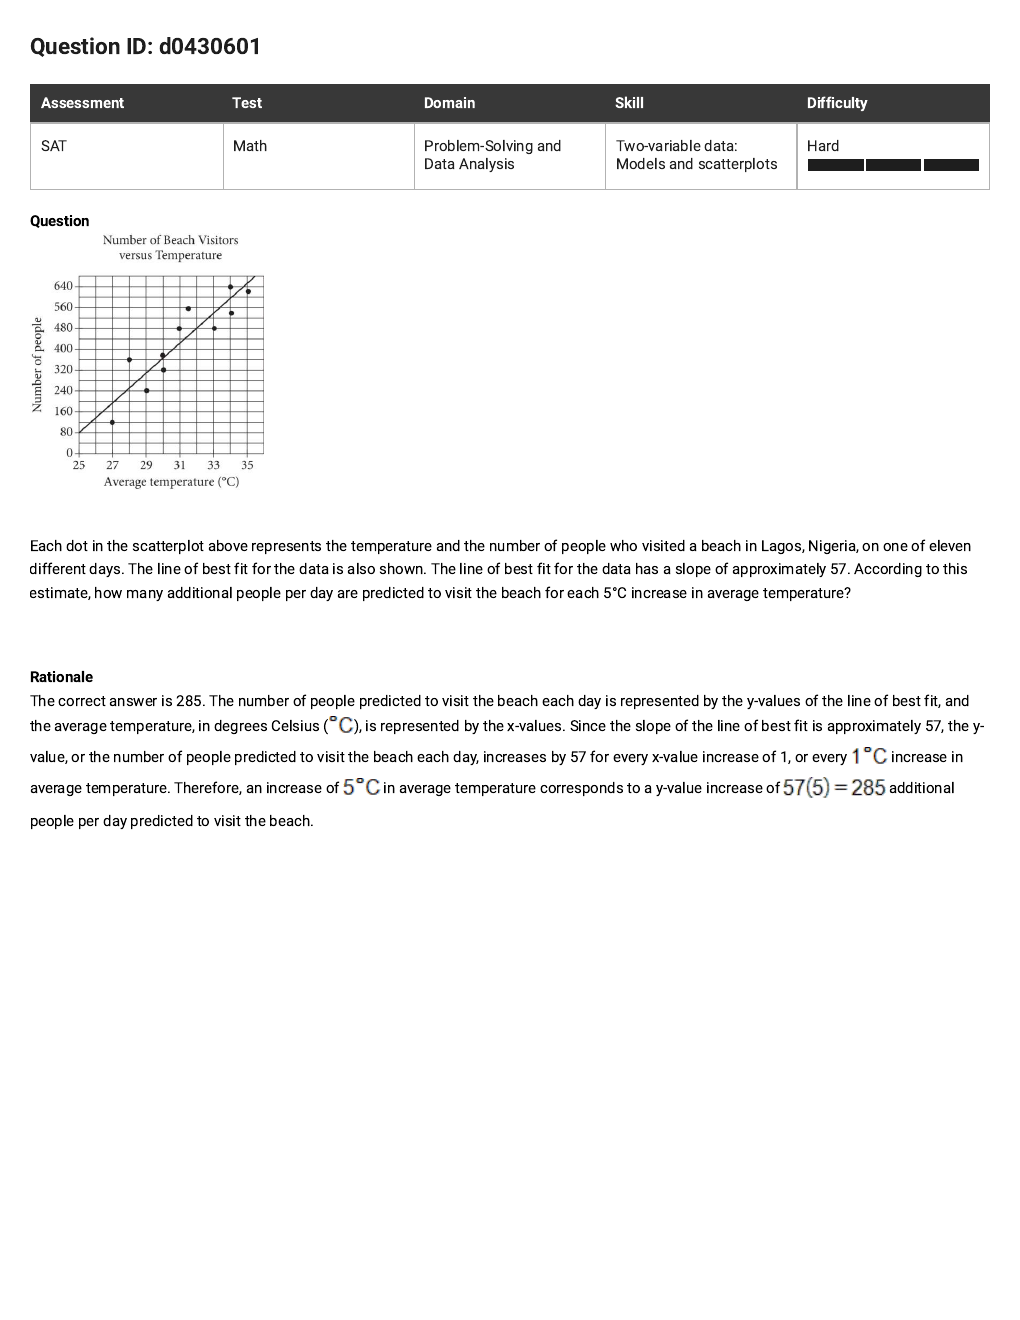
Original SAT Question Bank problem · d0430601 · new
HardWork from the same problem below.Use the guiding questions first, then submit the final SAT answer.
19Guiding step
A slope of 57 means how many additional visitors are predicted for a 1°C increase?
20Final SAT answer
How many additional visitors are predicted for a 5°C increase?